Each month I will cover two research articles on nutrition, training, sleep, supplements, or anything else that might help you. If you’d like me to cover a specific study next month send me a message on Instagram.
*Author’s note: if you want to learn how to interpret research go read each study before reading the breakdown below. I’ve now included a background section for those who only want to read my review and not the full paper.
Rather Listen? Check out the podcast for this Research Roundup, below:
Study #1
Big Question: Should we use single-joint or multi-joint movements and does the order matter?
Scientific Question: Do the effects of a 10-week resistance training program with multi-joint and single-joint exercises, either isolated or in combination, and in different orders, differ for muscle hypertrophy or strength?
Why:
Exercise order has been studied for a long time. It’s one of the easiest things to change when we workout, so if we can switch a few exercises around to increase muscle size or strength we probably want to do that. As a coach and physique athlete, I’ve used numerous “specialization” cycles to try to bring up lagging body parts. For me, it has somewhat helped me build bigger arms – though they’re still lagging behind pretty much everything else. Maybe I’m just destined to be a T-rex.
The current consensus on exercise order is to do big compound movements first. That would be your squats, deadlifts, and bench press. On an accessory day that might be shoulder presses or something similar. We do these movements first because they are a) more difficult than isolation movements and b) offer more bang for our buck, so doing more volume or intensity in the compound or complex movements can translate to better overall gains.
Who
50 healthy, young, and recreationally active men.
Study Details
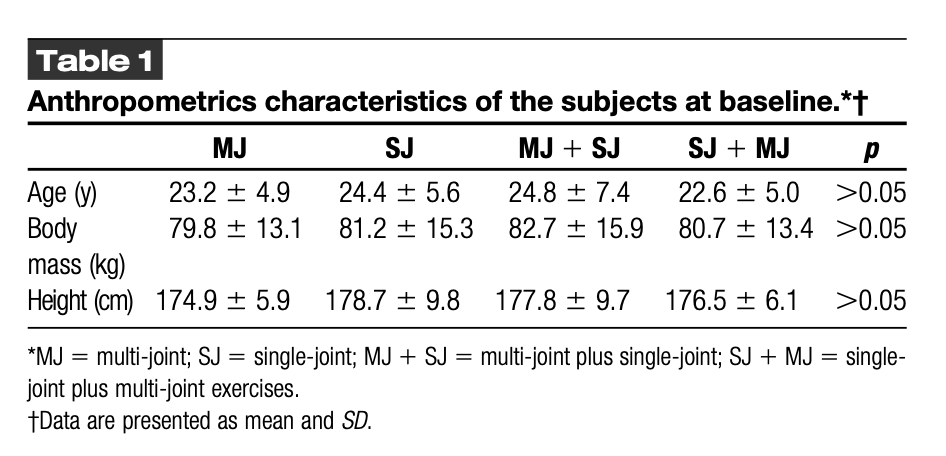
After dropouts, 43 subjects were analyzed. Below you can see the baseline data, with no statistical differences in anthropometrics between groups. That means they are relatively equal from the start and it let’s us know that we don’t have to make any adjustments when doing stats later.
Muscle size was measured for the triceps and chest using Magnetic Resonance Imaging (MRI). MRI is the gold standard for measuring muscle hypertrophy and uses radio pulse waves to induce the nuclear spin of atomic particles – particularly those in hydrogen – and electromagnetic fields are used to localize those particles. The measurements were taken 72 hours after the strength tests, which should account for any acute muscle swelling.
After measuring muscle size from each participant they were randomized to one of four training protocols:
Barbell bench press + Lying barbell triceps press (MJ + SJ)
Lying barbell triceps press + Barbell bench press (SJ + MJ)
Lying barbell triceps press (SJ)
Barbell bench press (MJ)
The training protocol was completed twice per week for 10 weeks. Exercises were done with 80% of 1RM to failure with 3 minute rest periods between sets. Sets were increased over the course of the study. I’d say this is a very practical training protocol for most males who want to build a big chest and arms.
| Week 1-4 | Week 5-8 | Week 8-10 | |
| Sets per exercise | 3 | 4 | 5 |
| Sets per week | 6 | 8 | 10 |
Results
The authors found no differences in bench press 1RM, tricep 1RM, or muscle size between groups at baseline. Again, these groups had an equal training history from the start.
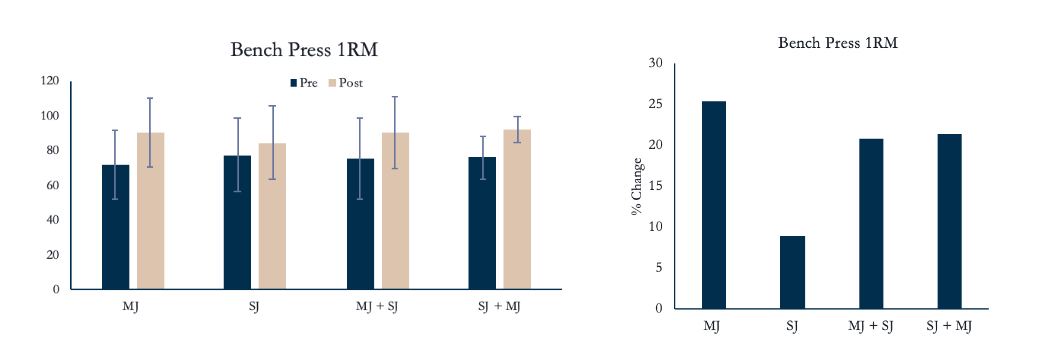
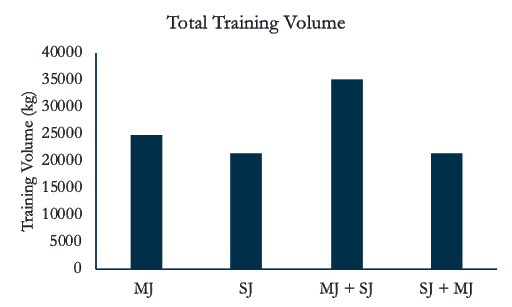
If we look at the data after the training program, we can see that 1RM bench press increased for MJ, MJ+SJ, SJ+MJ, but not for SJ. This tells us that we probably need to bench press if we want to get better at it. So far, the study follows the principle of specificity.
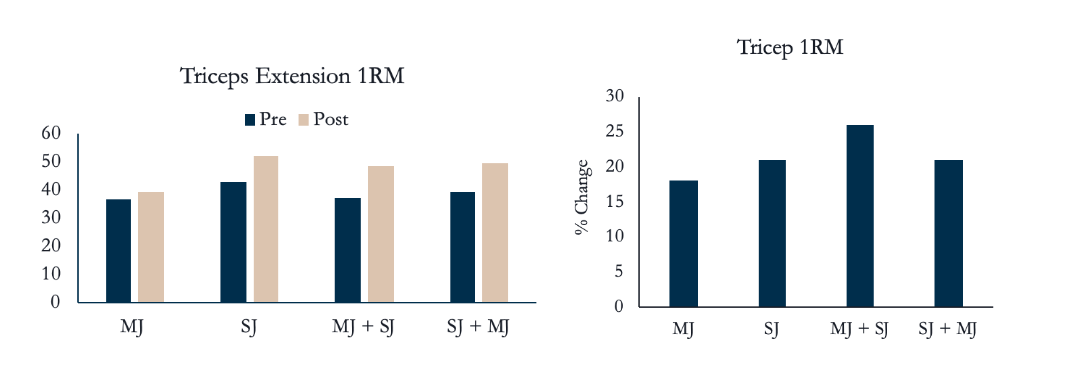
Likewise, 1RM for the triceps extension increased (non-significant) in all groups except MJ. This is interesting because we would think that doing a bench press would increase tricep strength, but that doesn’t seem to be the case.
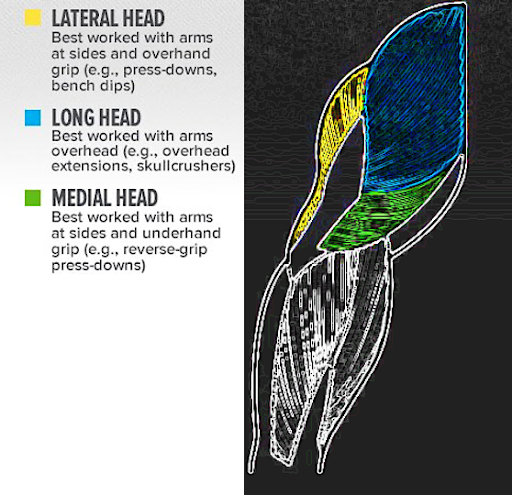
In terms of hypertrophy, the researchers measured three different heads of the triceps: lateral head, long head, and medial head.
The authors found increases in the lateral head for MJ, SJ + MJ, and MJ + SJ, but not for SJ.
The authors found increases in the long head for SJ, SJ + MJ, and MJ + SJ, but not for MJ.
The authors found increases in the medial head for SJ, MJ+SJ, and SJ+MJ, but not for MJ.
To translate that, the bench press didn’t seem to be a good movement to directly hypertrophy the long or medial head of the triceps, while the triceps extension wasn’t enough (alone) to hypertrophy the lateral head. This makes a good case for incorporating multiple exercises to maximize hypertrophy. We need to use different movements so we emphasize training different parts of the triceps.
Author’s Answer
Our data suggest that MJ and SJ exercises, either performed in isolation or combined in different orders, do not affect muscle strength gains, provided a high load is maintained between protocols. In addition, regardless of the exercise selection, we conclude that muscle hypertrophy is optimized in exercises where muscles act as agonists, and hence, exercise order might influence adaptations. Finally, muscle hypertrophy of all triceps heads occurred only when MJ and SJ exercises were performed in combination.
My Answer
There’s a nerd battle going on. It’s between two groups of exercise scientists. One group thinks that you don’t need single-joint exercises to improve strength and hypertrophy while the other group thinks that you do. The main differences in findings are due to how these research groups are testing strength. For example, one research group found similar increases in MJ and SJ strength using an isokinetic dynamometer, which applies force against you at a constant velocity. It’s commonly used in rehabilitation settings when people need to work around ligament injuries (video example). Other research groups use a 1RM test to measure strength, which is more practical, and these researchers think it’s important to include MJ and SJ movements to maximize strength and hypertrophy adaptations. One of these groups published a review concluding that SJ exercises are not necessary to maximize muscle strength and size. The other side shot back quickly, pointing out the issues with their idea.
Let’s think about the two sides for a minute. Who’s right? Who’s wrong? What’s your bias?
When we look at strength in the weight room, we’re usually focused on improving compound movements. That makes sense. I want a bigger bench press or squat. I don’t really care as much about my 1RM tricep extension. However, I do care about tricep training volume, as long as it translates to hypertrophy. Since we know that hypertrophy and strength are highly correlated, it’s logical to think that having single-joint movements in our training would help improve strength in our main lifts. This, in turn, would help us gain muscle. If you can’t tell — I’d side with the second group of researchers mentioned above.
Now, let’s get back to the study at hand.
The authors found, statistically, differences between groups for hypertrophy in the chest (pectoralis major) indicating that all the programs except the SJ protocol had an increase in muscle size. They also found statistical differences between groups when analyzing the absolute values for tricep size indicating all but the MJ protocol caused hypertrophy. The authors also report change scores, which focus on the amount of change due to the training and helps our interpretation of the nonsignificant tricep results. The results of the change score data show the same results for chest hypertrophy, but not for tricep hypertrophy. This could indicate that there was more variance in tricep size than chest size or the data is being influenced by a few high or low responders. The authors don’t provide single data points so it’s difficult to understand why the absolute values and change scores don’t match for tricep size.
Most guidelines (NSCA, ACSM) recommend that we do multi-joint movements before single-joint movements. For athletes, and the general population that’s true most of the time. On the other hand, if we want to grow specific muscle groups we may want to prioritize them. I like to use specialization cycles to do this, which generally have higher volume, or frequency, and means doing specific exercises first in a workout. For example, doing arms before legs if we want to focus on arms. Another example is to increase the frequency from 2x per week to 3x per week with one of those extra sessions being completely dedicated to arms. Sometimes we have to let the bro in us shine.
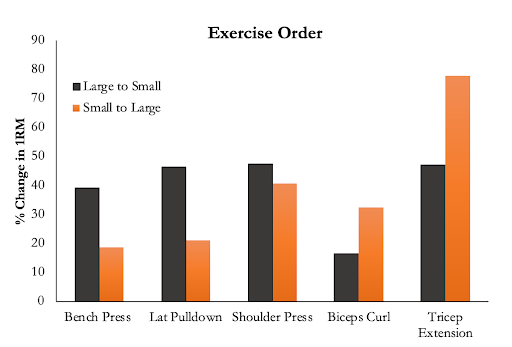
There is ample evidence to suggest the order of exercise matters. One study tested exercise order on young untrained men. They assigned lifters into groups that exercised large to small muscles (chest -> arms), and small to large group exercises (arms -> chest). There were also no differences in total work performed. But as you can see below, the group that did bench press and lat pull-down first, improved those exercises the most. The same is true for the group that started with triceps extensions and biceps curls. While this study didn’t measure hypertrophy and was in untrained women, it does lend credence to something we see in practice: do the thing you want to improve the most first.
Now we can rationalize why everyone does bench press first in a workout. They want a better bench press. Or maybe it’s because they think it’ll help the chest grow more. I have no rationalization for why everyone does chest on monday. No data either.
However, it doesn’t seem to matter as much which exercise we start with for hypertrophy. To hedge a little, it takes longer to increase muscle size than increase strength. Most of the studies are short-term and if all we’re doing is flipping the order of exercises it could take more than ~8-12 weeks to be able to tell the difference. That’s why we would probably want to use multiple cycles of specialization if we wanted to see differences over time (see “how can we apply this?” below).
If you want to read more about exercise order check out this article I co-wrote or a review and meta-analysis on exercise order.
Another thing I’d like to touch on is regional hypertrophy. This idea is fairly novel in the research world.
What is regional hypertrophy? It’s when a specific part of your muscle grows in size.
The findings from the current study suggest that nonuniform muscle hypertrophy is maximized by the combination of MJ and SJ exercises. The authors attribute this to the length-tension relationships.
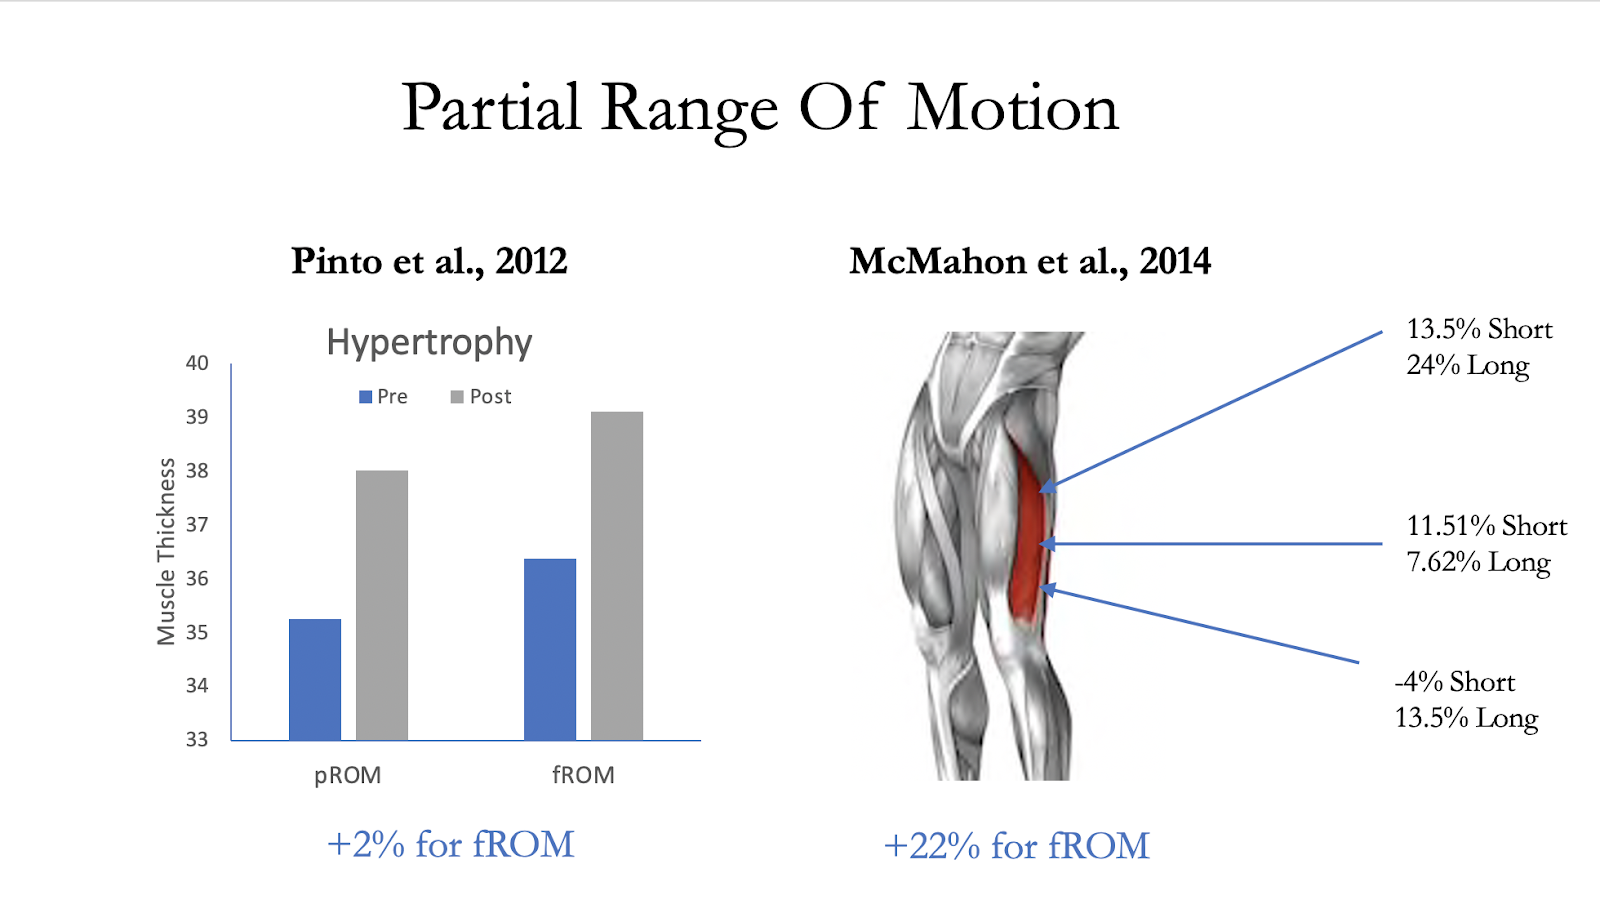
We know that certain exercises or ranges of motion can directly target portions of a muscle. Two studies that have used partial range of motion are Pinto et al., 2012 and McMahon et al., 2014. The basic idea is that certain movement ranges hypertrophy certain regions more. Next time a regional hypertrophy study comes out I’ll go into more detail.
How can we apply this?
If we’re training for hypertrophy we should include different movements in our program to target different areas of the same muscle. We can also switch the order of exercise if we want to focus on a specific muscle group or exercise.
What’s next?
I think the next steps are figuring out which movements are best to cause hypertrophy in certain areas. We have EMG data to help guide exercise selection, but that can be deceiving and may not reflect the long-term changes we seek.
Study #2
Title: Effect of Weight Loss via Severe vs Moderate
Energy Restriction on Lean Mass and Body Composition Among Postmenopausal Women With Obesity
The TEMPO Diet Randomized Clinical Trial
Big Question: Is dieting fast or slow better for weight loss?
Scientific Question: What are the effects of severe vs moderate energy restriction on lean mass and other aspects of body composition?
Why
When dieting we want to lose weight in the best way possible. For some people, that’s really fast so they can get it over with and return to a normal life. For others, it’s really slow because they’re preparing for a photoshoot or some time of physique competition. Or they really enjoy pain.
The question is which method is better? If we lost a ton of weight really quickly are we at risk of losing muscle? Or will it just be glycogen and water? That’s important to know, especially if you’ve been working hard to put on that muscle. We don’t want to undo months of work to be lean. We don’t have many studies to guide us when choosing between slow or fast weight loss, and this study sheds a little light (or does it?) on which method to choose.
Who
A good way to put a study into perspective is to look at the CONSORT diagram (Figure 1 in the study). Here you can see how difficult it is to recruit participants. The authors started by screening over 2500 people. They lost the majority of those through an email screen and were left with 401 to be screened by telephone. They then had to call all 400 people and ask them a series of questions that took at least 20 minutes which caused them to lose another 250 people. Then they brought those people into the clinic and lost another 50 for various reasons. Finally, they were left with the 101 people. Only 4% of the original people they contacted even started the trial. They then lost 16 more during the trial, so they had 85 women complete in. Science is hard.
Ultimately, they randomized 101 post-menopausal women to severe or moderate energy restriction. The participants were 58 years old with an average BMI of 34.3 and were untrained.
The study took place in Australia from 2013 to 2016. It’s now 2020. It took four years for the primary analysis to be published and the published protocol and rationale was published two years after completion of the study. Science is slow.
Study Details
Unlike some of the previous studies I’ve analyzed in the monthly research roundup, this study had a published protocol and rationale. This type of manuscript outlines the outcomes, inclusion/exclusion criteria, and the rationale for the study. It can also be used as a reference for the author to abbreviate the methods in subsequent publications. When reading research we need to make sure these outcomes match the information published in the current study to see the full picture. After reading through the pre-published protocol we can see that “the aim of the current work is to make a head-to-head comparison of the long-term (3-year) effects of fast versus slow weight loss, notably with respect to body composition, but also on eating behavior.” The current study only reports the first 52 weeks of the trial, so we need to keep that in mind because there will be a follow-up study that captures the long-term effects. There are also a ton of other outcomes not reported in the current study (e.g. eating and sleep questionnaires) that would help us identify which group did better and why.
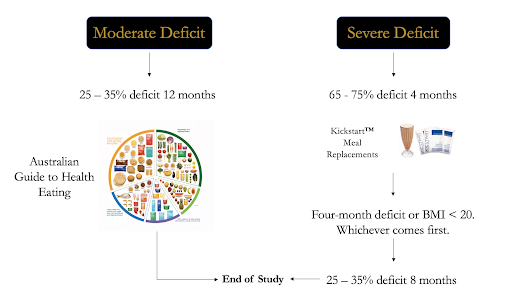
The participants were randomized to either a moderate or severe deficit. The severe deficit group consumed pre-packaged Kickstart meals (shakes or soups) and the moderate deficit group consumed a diet in accordance with the Australian Guide to Healthy Eating:
→ At least 5 servings of vegetables every day.
→ At least 2 servings of fruit every day.
→ 2 servings of milk, yogurt, cheese (or alternatives) every day.
→ 5-6 servings of mostly wholegrains.
→ 2-3 servings of lean meat, fish, eggs, tofu or legumes/beans.
Figure 1. Groups were randomized to a moderate or severe deficit.
Both groups were prescribed a protein intake of 1.0 g/kg/bodyweight per day. They were encouraged to have a step count between 8,000 – 12,000 per day, and exercise at a moderate to vigorous level for 30 – 60 minutes per day although it was not supervised.
Dietary adherence was not measured via food logs, rather it was tracked by body weight loss. The authors expected 1.5-2.5 kg/week in the severe deficit group and 0.5-1.0 kg/week in the moderate group. To increase adherence, participants met with a dietitian every 2 weeks for the first 26 weeks and then every month until the end of the study (52 weeks total).
The authors measured body composition by DXA, thigh muscle size via MRI, and strength with a hand dynamometer.
Results
Body Weight
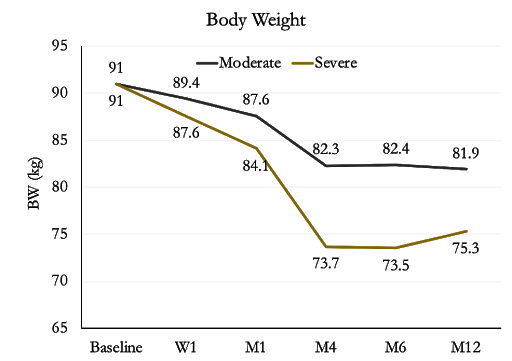
Both groups significantly decreased body weight at all time points compared to baseline. As expected, the severe group lost more body weight than the moderate group.
An interesting observation from the body weight graph is that both groups stopped losing weight at ~4 months (M4), and the moderate diet group was better at maintaining the weight loss while it appears the severe group was beginning to increase weight. This may indicate that the moderate deficit group – even if not causing as much overall weight loss – makes weight maintenance more realistic. Weight maintenance is very difficult after dieting, so this could help some populations adapt to eating in a healthy manner. We also have to remember that the moderate group and severe group were actually prescribed the same rate of loss (65-75% deficit) for the first four months. The only difference was the type of food they were consuming. The difference in body weight between the two groups tells me that pre-packaged meals probably had better adherence because it requires less effort to eat meal replacements, which would explain why they lost more weight.
Lean Mass
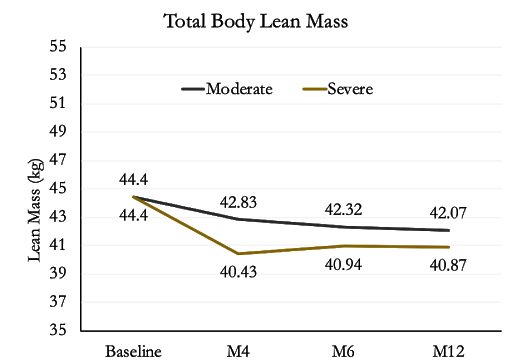
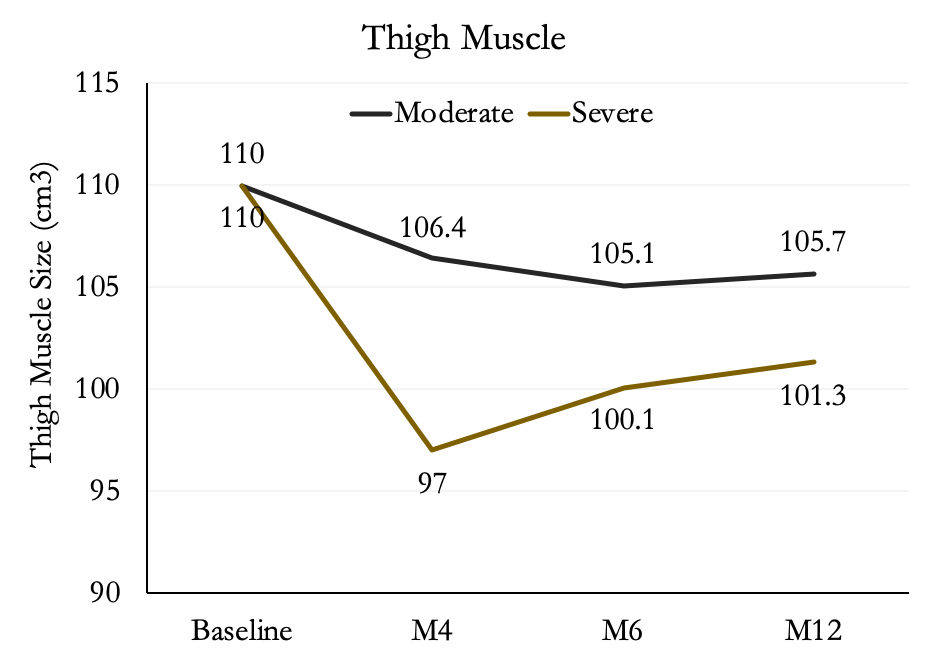
Both groups lost a significant amount of lean body mass, at all time points, compared to baseline. Importantly, the severe deficit group lost significantly more lean mass compared to the moderate group. They also measured thigh muscle size via MRI. The reason we care about thigh size, in addition to total lean mass, is because organ mass is counted as lean mass using a DXA. Organs might shrink with dieting and we’re more concerned with muscle mass, which is better reflected if we isolate the thigh. In addition, we don’t know if they were resistance training or if they had a non-adherence refeed before the final DXA scan which could manipulate lean mass outcomes.
Thigh Muscle Size
There was a significant loss in thigh muscle size for both groups. However, the moderate group lost significantly less thigh muscle size than the severe group.
Bone Mineral Density
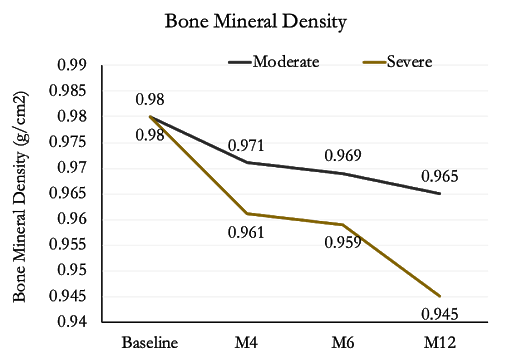
Both groups lost a significant amount of bone mineral density (BMD) over the course of the study. The rate of BMD loss in the moderate group was ~1.3% and the rate of loss in the severe group was ~3.3% which is much higher than the average rate of loss in this age group. During the last six months of the study the severe group had a large decrease in BMD even though they were not losing weight – that’s odd. To add some context, these participants were fairly well off in terms of BMD at the start of the study (95th percentile) and were still well above average by the end of the study (85th percentile) when compared with data for their age group.
Grip Strength
There were no significant differences between the severe and moderate groups in dominant or nondominant handgrip strength. Handgrip strength is commonly used in studies on aging as a biomarker for health since it strongly correlates with mortality and poor health.
Author’s Answer
In this randomized clinical trial, severe energy restriction with a total meal replacement diet in postmenopausal women with obesity induced greater weight loss and approximately 1.5-fold as much loss of whole-body lean mass and thigh muscle area compared with moderate energy restriction over 12 months. While these losses of lean tissues were proportional to the amount of weight lost and while, handgrip strength was unaffected by severe vs moderate energy restriction, there was an approximately 2.5-fold greater loss of total hip BMD with severe compared with moderate energy restriction, a difference not accounted for by the greater weight loss.
My Answer
I chose this study because of a recent discussion on the Revive Stronger podcast where Steve interviewed Martin MacDonald. Yes, I listen to a lot of fitness podcasts. The discussion revolved around the appropriate rate of weight loss. I was a little surprised at the interpretation of the study, so I decided it was worth a deep dive to see if I agreed with them.
The question most people want to know is — should I diet fast or slow?
The answer is always: it depends.
It depends on what type of diet you’re following.
It depends on how much cardio you want to do.
It depends how much fat mass you start with.
It depends on how long you can adhere.
It depends on your level of life stress.
It depends on how you exercise.
It depends on your NEAT.
It just depends.
Back to the study at hand.
These were untrained participants, with presumably no background in nutrition or exercise (BMI = 34). They are a prime population for a diet study because they need to lose weight to stay healthy. However, this was not an ideal intervention for testing how much lean mass or bone mineral density we would lose because they didn’t strength train. They were just given advice to do physical activity. While this study wasn’t in a relevant population to some readers since the participants were postmenopausal women, we can still extrapolate from the findings and attempt to learn something… or maybe we can’t. That would be reasonable too.
Let’s strike one big issue first: we, the readers, have no idea what the participants were eating in the moderate group and only a modicum of idea in the severe group based on the reporting of this study. They could’ve collected data on the severe group more easily since it was a meal replacement, but they didn’t report any. They used body weight instead to measure adherence. The participants had check-ins with a dietitian, and it is mentioned in the published protocol and rationale that the dietitians collected food diaries. Where’s that data?! It might come out in a subsequent study or it might be too messy to do anything with. I think some of the most important data that could be reported was the protein intake since it was prescribed at a somewhat decent level (1g/kg). A food log is better than nothing, even though we know that underreporting is rampant.
Ok, so let’s identify what this study really found, focusing on the first four months since there was very little change after that in either group. Remember, the deficits were supposedly matched during that period.
The moderate deficit group lost ~8.7 kg in body weight. We can also see that they also lost ~1.6 kg of lean mass. These are rough estimates but that means ~18% of the weight loss was lean mass. This is somewhat below previous research which indicates that 25% is the norm. The prescribed extra protein might have helped retain lean mass in this study. Although we don’t actually know if they ate it.
The severe deficit group lost ~17.3kg in the first four months. Of that weight, they lost ~4kg of lean mass. Simple math puts that at ~23% of weight loss being lean mass. Worse than the severe group, which isn’t surprising, yet more in line with previous research.
There was a ~12% loss in muscle thigh size for the severe group and a ~4% loss in the moderate group. That is a heck of a difference and makes me wonder why it occurred. Could it be that the severe group thought they didn’t have to exercise because they were in such a severe deficit? Or maybe they didn’t have the energy to move as much. We really don’t know. What we do know is that this makes the severe deficit much less ideal. If we add in the bone mineral density losses in the severe deficit group then things are looking pretty sketch.
This is just dieting. What if we add in resistance training? Does it help retain muscle mass?
According to a recent meta-analysis on exercise and caloric deficits in a similar population as the current study, resistance training was able to prevent almost all of the caloric deficit induced muscle loss.
Wow. So if we resistance train we can prevent most of the muscle mass loss? Not so fast. These participants are untrained, and body recomposition (lose fat, gain muscle) happens the most in this type of population.
What if we look at a trained population?
In the June Research Roundup I covered the Campbell et al., refeed study. Those researchers saw roughly 0.8kg of lean mass losses with a ~25% caloric deficit in trained participants, which occurred over 7 weeks. That’s not so bad. It could be within some measurement error and may include glycogen changes. Those participants were ~21% body fat so they weren’t super lean either. However, the Campbell study used less than half of the deficit imposed in the first four months of this study so it’s not ideal to use as a comparison.
Another relatable study is Hulmi et al., 2016, which followed female physique competitors with an average ~22% caloric deficit for 19 weeks. The authors found no losses in lean mass via DXA. These competitors had high levels of protein intake and plenty of resistance exercise. I would caution this may be one of the benefits females have when dieting – retention of more muscle mass. This could be because when males diet to a very lean state their testosterone drops immensely.
How can we apply this?
Umm. I’m not sure we can take much from this study. In fact, I don’t think it really tells us much of anything we can apply to trained people who are trying to figure out what rate they should lose weight. If you take an average diet (2000kcal) and add a 65-75% caloric deficit you’ll end up around 500 – 700 kcal. I don’t know how well your training would be with that type of intake. I wouldn’t recommend it.
What’s next?
There is a lack of studies using different rates of weight loss and/or caloric deficits. Ideally, we would see a dieting dose response study that uses resistance training with high(ish) protein.
ps – as we went to publish this the three year study came out. I didn’t have time to fully analyze it, so have a read here if you want.
